Levelling up and down Britain

No part of the UK has been unaffected by the pandemic labour market shock, but both the initial hit and subsequent bounce-back have been uneven across places. Although employee numbers are back to pre-pandemic form in many parts of the country, in some regions (most notably, London) the jobs recovery has a long way to go. Critically, these geographic differences cannot be fully explained by the industrial mix of an area.
Below the regional level, tourism-reliant areas (such as Cornwall, Gwynedd and the Causeway Coast and Glens) have seen job numbers pick up in recent months. In contrast, employee numbers in cities including Edinburgh and London continue to lag their pre-pandemic levels (furlough rates remain particularly high in London, boding ill for the future). We point to two key reasons this is the case. First, although many have embraced a British holiday this summer, home-working remains commonplace: trips to work in London, Cardiff and Belfast, for example, are still down on pre-crisis levels. Second, higher-wage areas (like Westminster, Camden and Aberdeen) are also the places where the jobs recovery has been weakest, suggesting that residents are also not spending to the same extent as they were pre-Covid.
Low-wage workers across the country have borne the brunt of the Covid-19 labour market shock, but those living in areas that the jobs bounce-back has so far passed by appear likely to be at the sharp end today. Whether or not this uneven recovery endures is an open question. But a structural shift to more home-working or less commuting could have a lasting impact on the geography of the UK labour market, and a living standards effect to boot. We will be exploring this issue further, in partnership with the Centre for Economic Performance at the LSE, as part of The Economy 2030 Inquiry.1
Nowhere escaped the pandemic labour market hit, but stark regional differences remain
Every part of the country has been affected by the Covid-19 labour market shock: this is unsurprising given that the shutdown sectors of the economy are widely dispersed geographically. But some areas have clearly been harder-hit than others. In the early phase of the crisis, for example, we highlighted the plight of parts of the UK that were dependent on tourism. In this short note we take a look at the latest HM Revenue and Customs (HMRC) PAYE and furlough data which provides us with the timeliest take on how different areas are faring as restrictions lift and the country moves into the recovery phase.
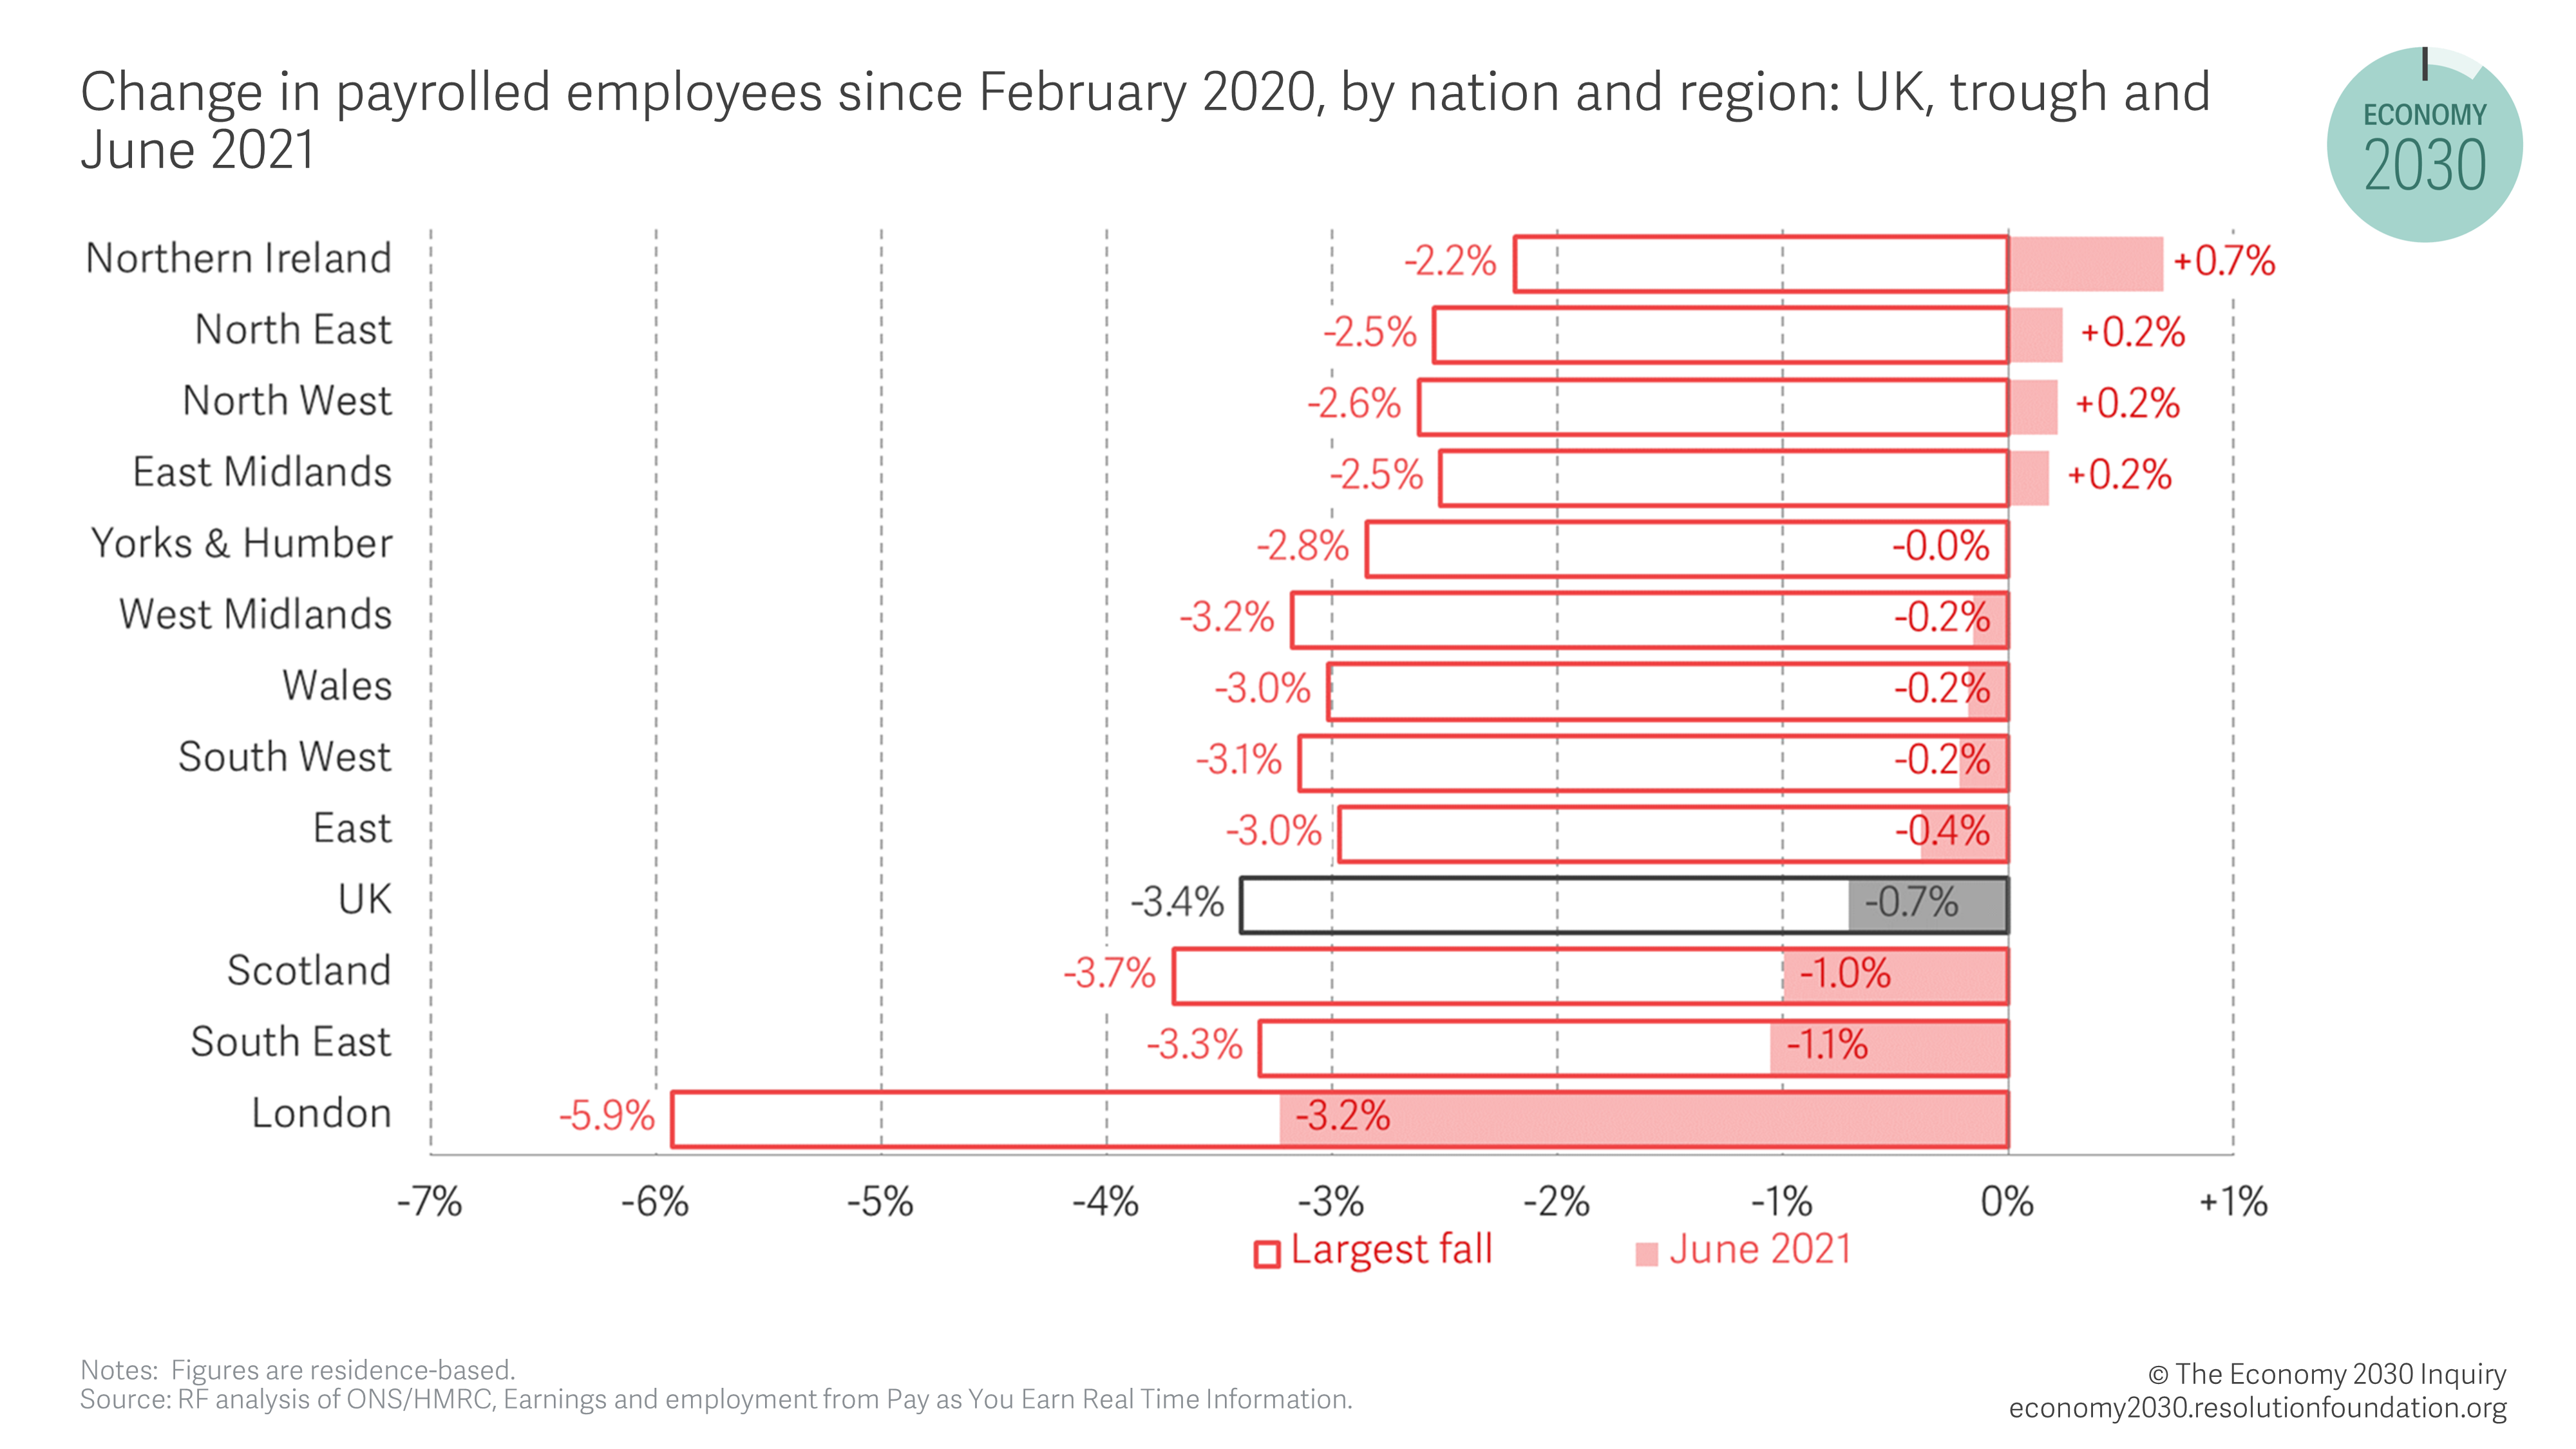
We begin with Figure 1 which provides a broad overview of the Covid-19 labour market hit and bounce-back to date. Here, we show the percentage change in the number of payrolled employees since February 2020 for nations of the UK and regions of England (furloughed workers are counted as employed on this measure). As this makes clear, those areas which experienced the weakest Covid-19 jobs hit in the first instance have now returned to form: employee numbers in Northern Ireland, the North East, the North West and East Midlands in June 2021 were above pre-pandemic levels. Other regions are not far behind, with close to as many people living in the West Midlands, Wales, the South West and the East of England regions in employee jobs in June 2021 as in February 2020. Trailing behind these are Scotland and the South East of England, which still have some distance to travel, but it is in London where jobs numbers remain severely suppressed. In the depths of the crisis (November 2020 to March 2021) employee numbers in London fell by close to 6 per cent compared to February 2020; by June 2021, the capital had made up less than half of this ground with employee jobs still more than 3 per cent below their pre-crisis level.2
Figure 1: Employee numbers are back at, or close to, pre-pandemic form in many nations and regions, but in London the jobs recovery has a long way to go
These geographic differences cannot be fully explained by the industry mix in different regions
Industry has been key to explaining many of the differential labour market impacts of the Covid-19 crisis to date: for example, young people and those on low pay have been hard-hit not because they are young and low-paid, but because they are clustered in sectors such as non-food retail, hospitality and leisure which have been most affected by lockdown measures. So, is the geographic variation we observe in the recovery phase to date also explained by the industry mix of different regions? Figure 2 suggests in some areas it most definitely is not. Using a ‘shift-share’ analysis, we estimate the change we would observe in a region’s employee jobs count in June 2021 compared to February 2020 given its pre-pandemic industrial composition and the national rate of change observed in each sector between those two dates (the red bar). As this makes clear, if the Covid-19 jobs recovery was simply a sectoral story, there would be only small variations between different geographies when it comes to employee jobs change since February 2020 (ranging from -0.5 per cent in the North East to -1.3 per cent in London).
Figure 2: Sectoral differences between regions explain only part of the geographic variation in employee jobs numbers
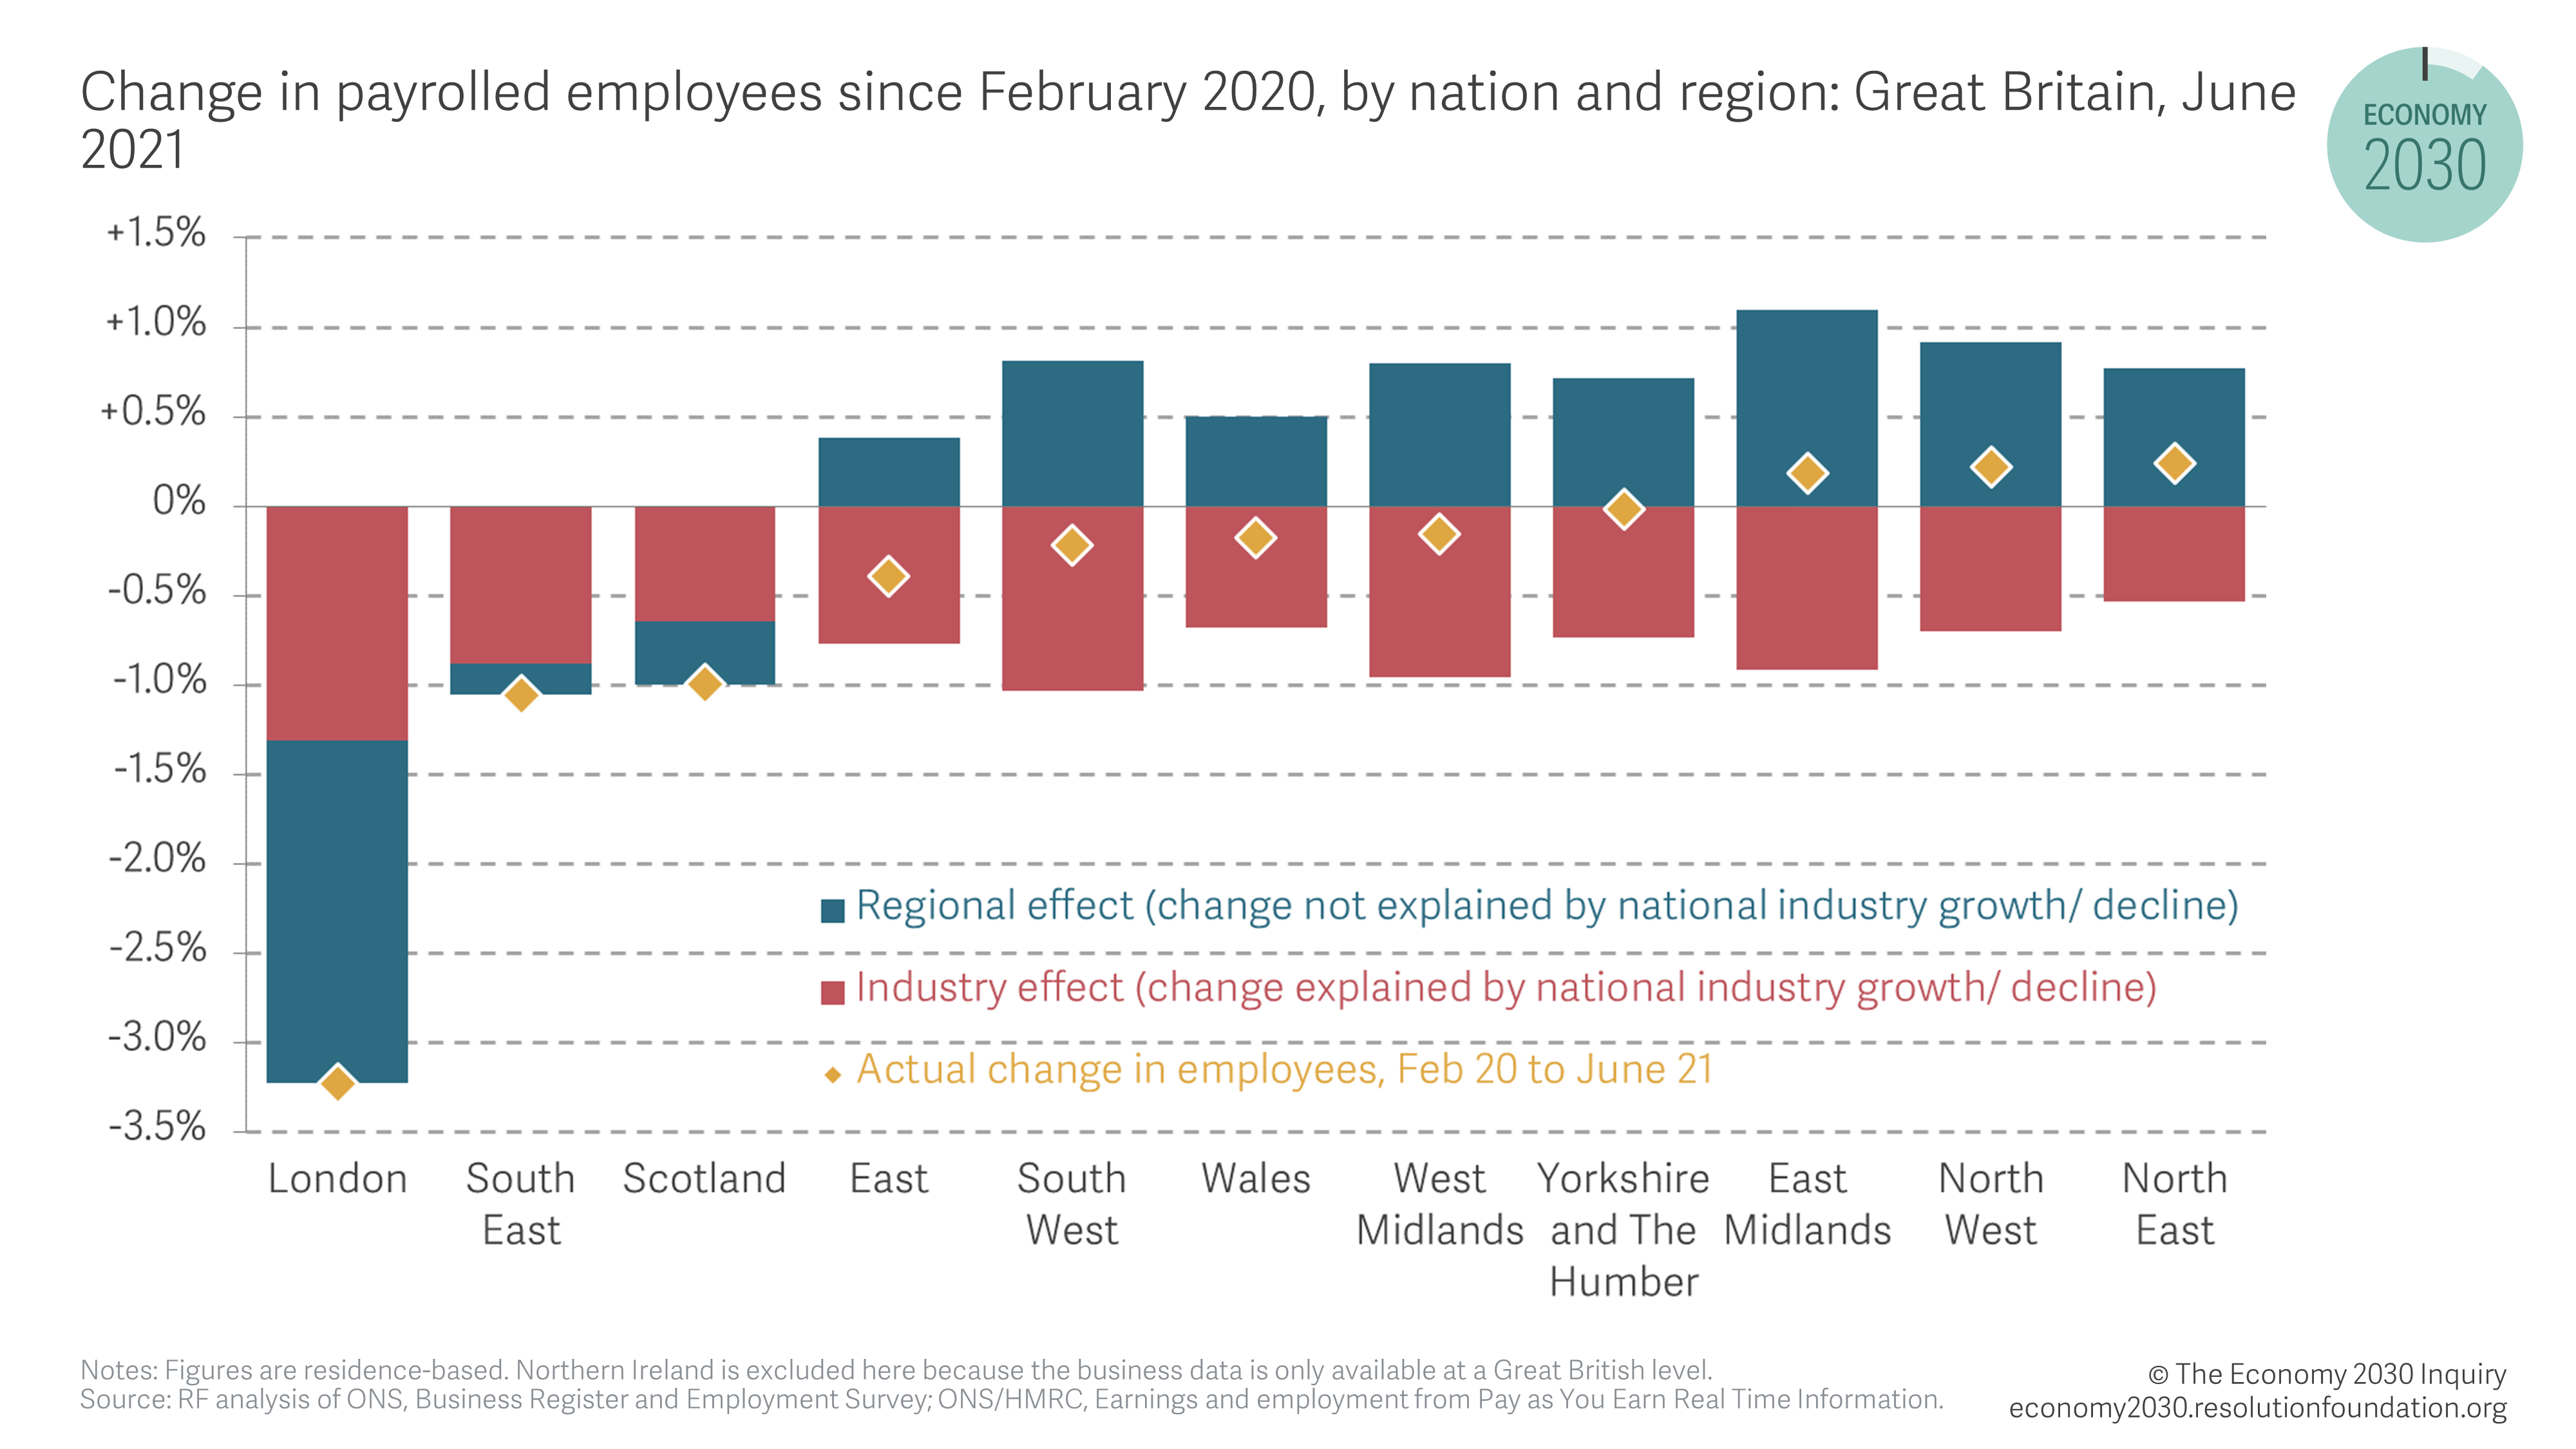
As a result, the considerable differences we observe between regions when it comes to the rate of recovery in employee jobs suggests there is a drag factor in some parts of the country which goes beyond sectoral mix. At a regional level, London is the main case in point. If London’s industries had taken the same labour market hit as the rest of Great Britain, we would expect the number of employee jobs currently to be 1.3 per cent lower than they were in February 2020. In fact, we observe an actual fall of 3.2 per cent, indicating that London’s industrial mix explains less than half of the overall change in employees’ jobs currently.
Jobs in coastal areas have bounced back, but in some cities prospects remain depressed
Data at a more finely-grained geographic level can help us better understand what has driven the jobs recovery in some regions but is holding it back in others. In Figure 3 we show that the pandemic jobs hit was felt especially acutely in the early part of the crisis in city centres and coastal areas of the UK (such as Cornwall and the Isles of Scilly, Gwynedd, and Brent), both types of place where many workers’ jobs depend on demand from people who live outside the area. As restrictions have eased, however, coastal areas have experienced an employment recovery, no doubt in part because of the current taste for ‘staycations’. In contrast, the number of employee jobs in some cities remain depressed: in Edinburgh, for example, the count was more than 2 per cent lower in June 2021 than in February 2020. Critically, London’s labour market continues to be very hard hit: nine of the ten NUTS3 areas which have seen the highest share of payrolled employees drop out of work since the start of the pandemic are in London (with Aberdeen being the other).
Figure 3: Coastal areas have seen a jobs bounce-back, but some cities remain suppressed
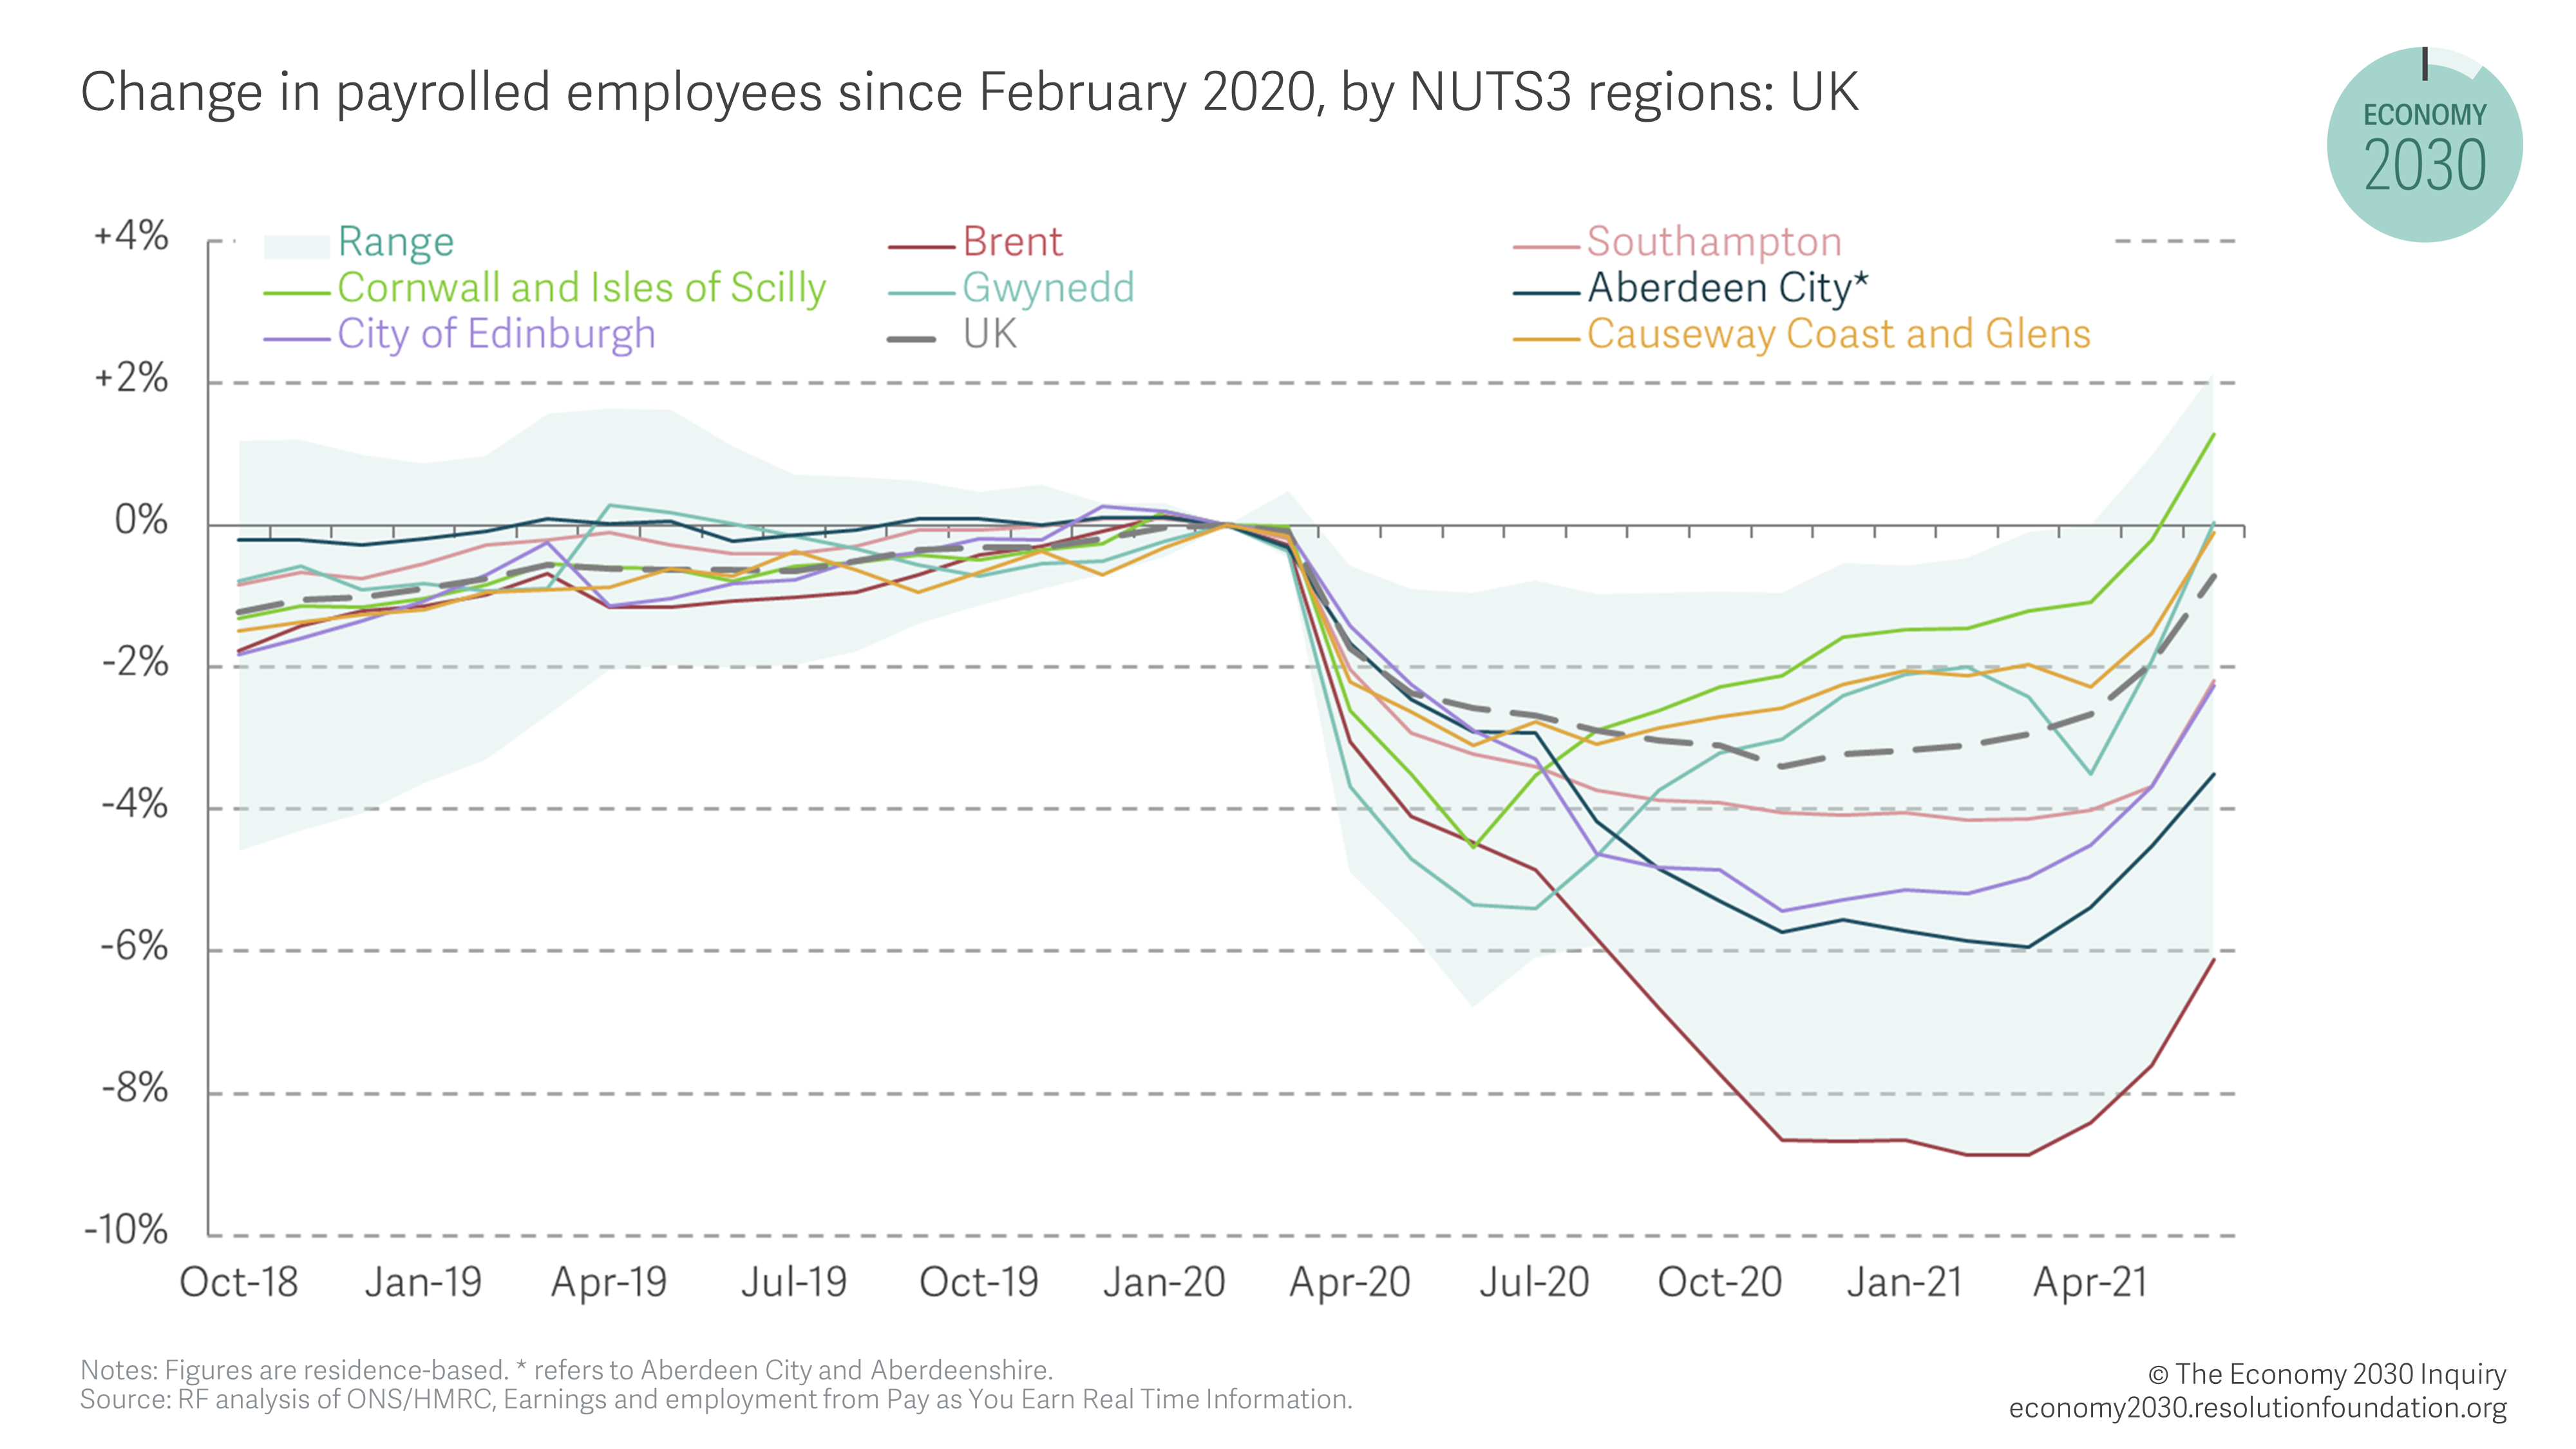
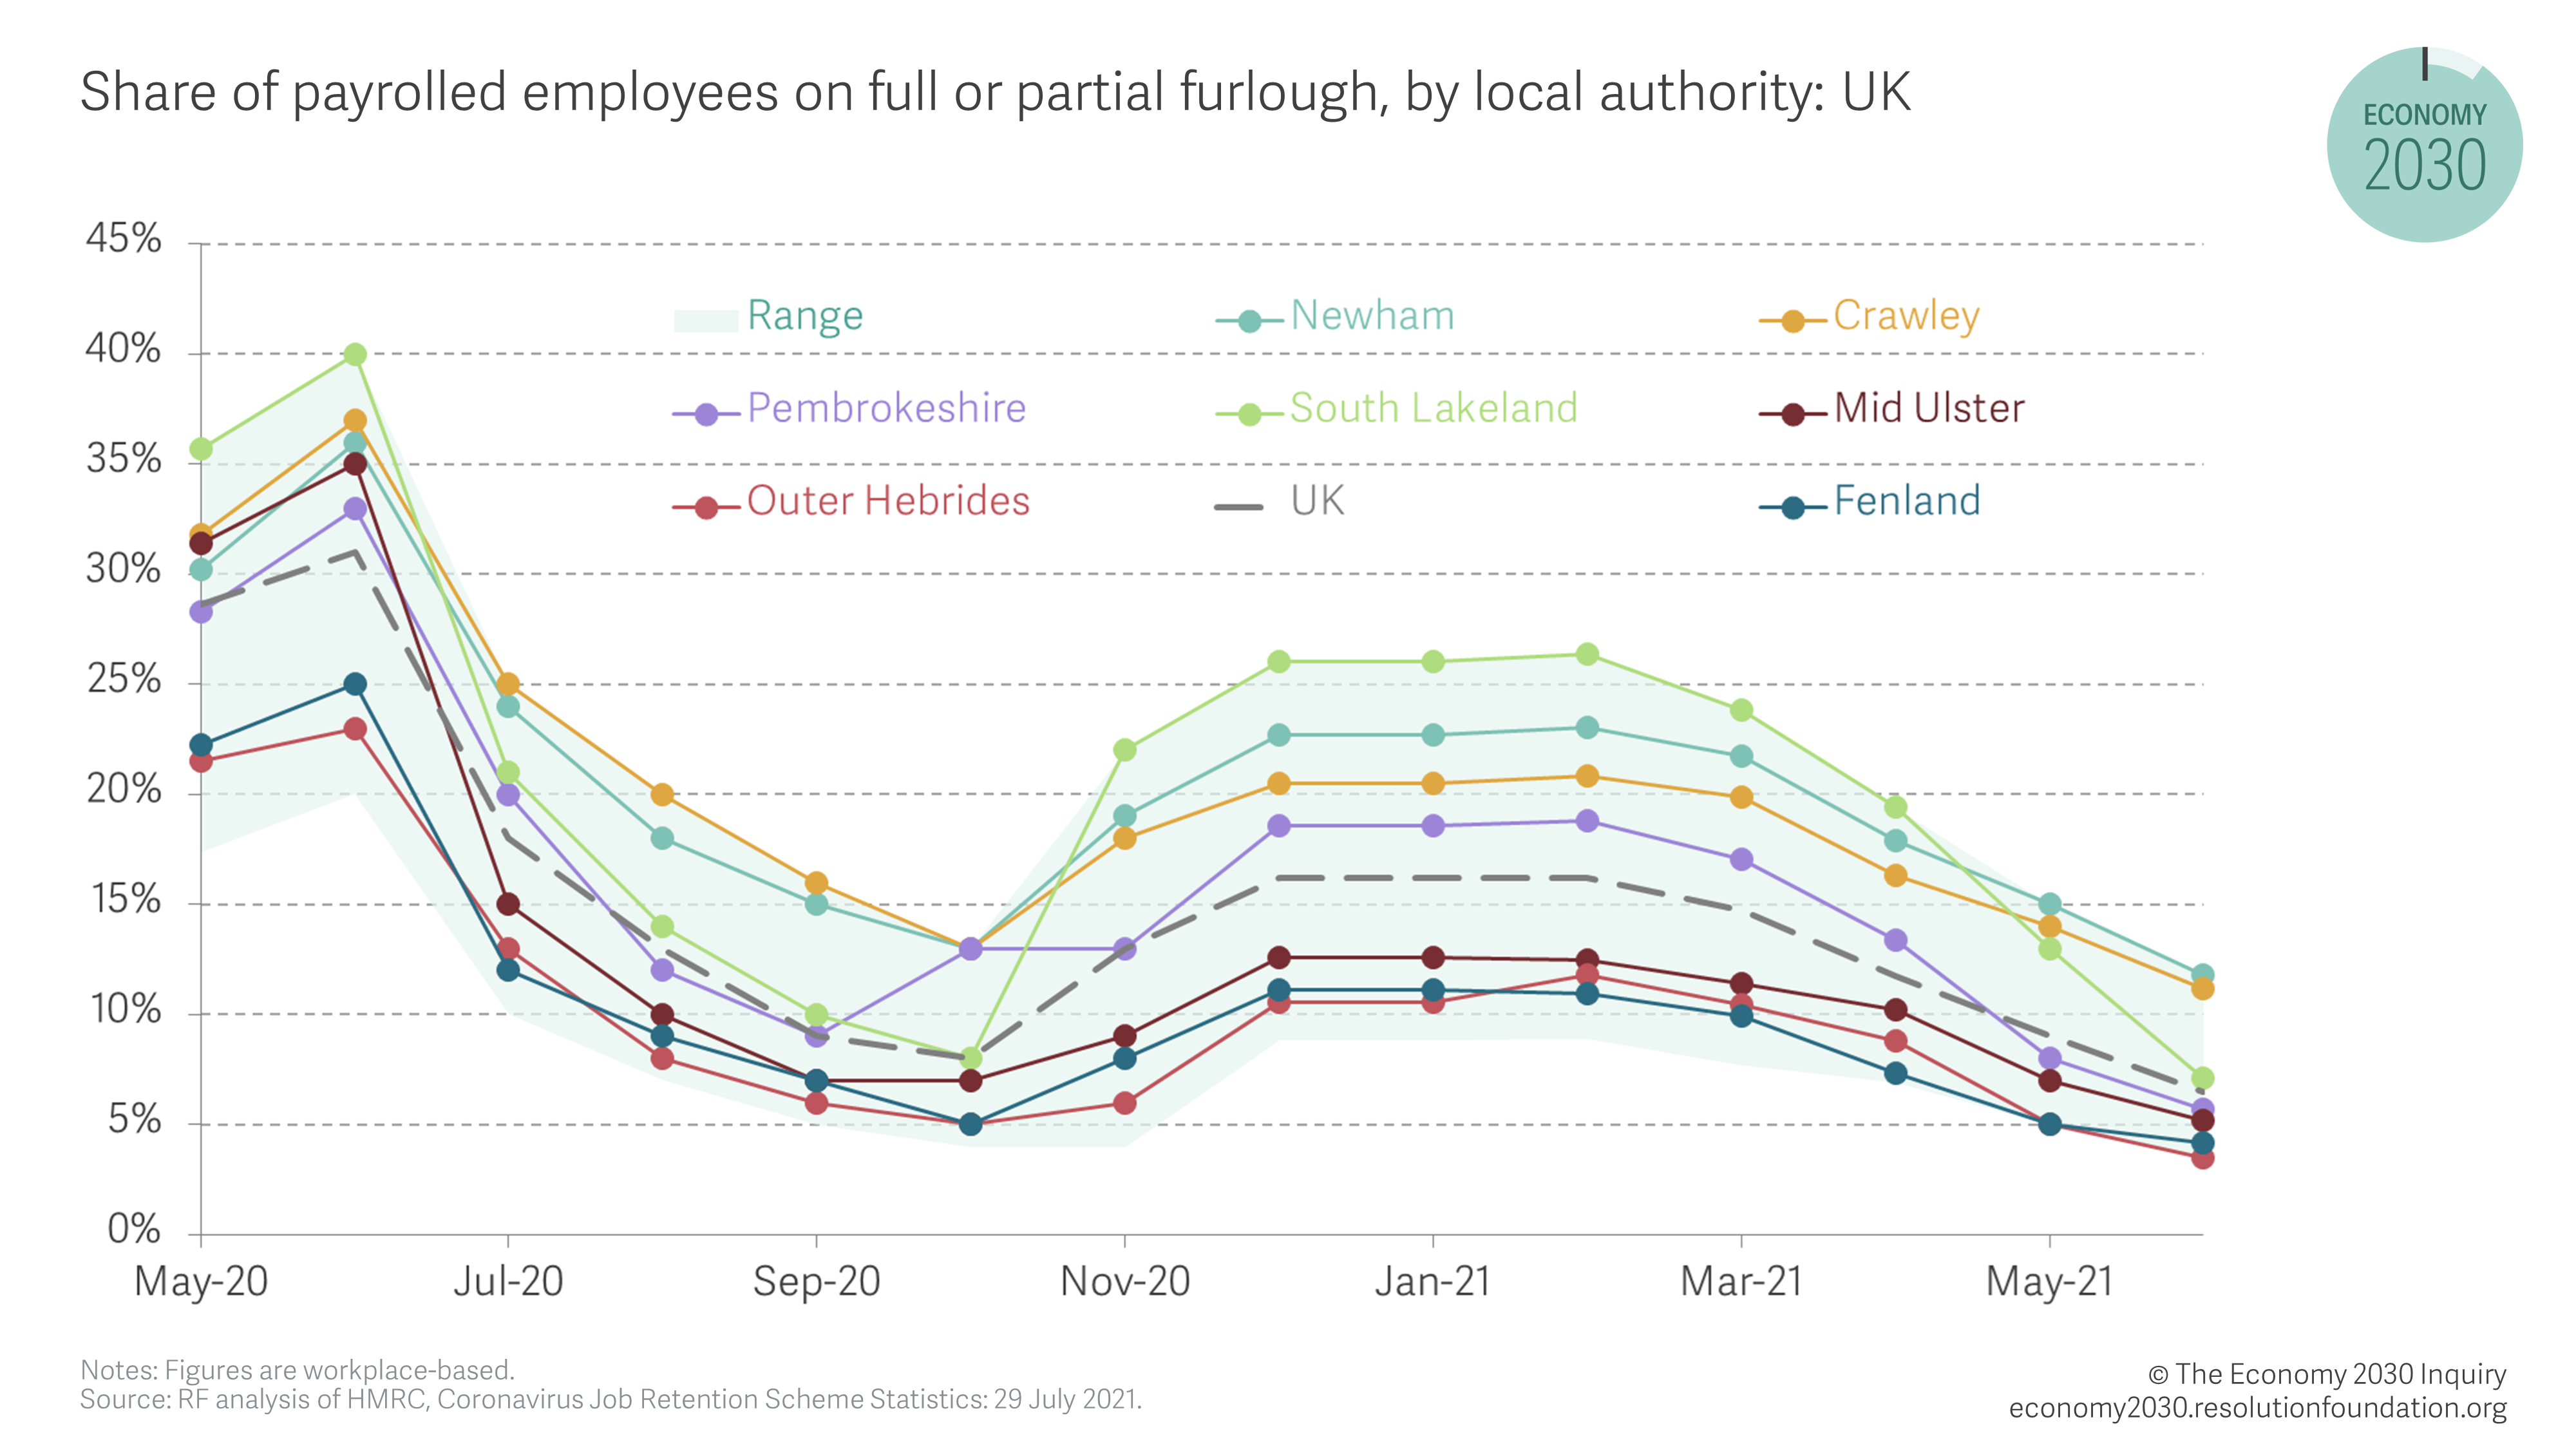
Figure 4, which shows (workplace-based) furlough rates across local authorities between May 2020 and June 2021, adds another layer to this finding.3 In February 2021, the two highest furlough rates were in South Lakeland (26 per cent of workers) and the London Borough of Newham (23 per cent). By June 2021, furlough rates dropped to 7 per cent in South Lakeland, but still stood at 11 per cent in Newham. Again, nine of the ten local authorities currently with the highest share of workers furloughed are in the capital (the exception on this measure is Crawley, no doubt because of its proximity to Gatwick airport). These figures tell us not just about the current situation but also hint at where we may see further downward pressure on jobs in the autumn when the furlough scheme ends.
Figure 4: Big gaps in furlough take-up still exist between local authorities
Overall, different types of behaviours appear to be driving the geography of this summer’s recovery. The reluctance of many to go back to the office is clear. Google mobility data shows that in late July, for example, trips to work in Edinburgh, Cardiff, Belfast and London were still down at least one-third on pre-pandemic levels. At the same time, retail and leisure trips were up at least one-third in Cornwall, Gwynedd, South Lakeland, and Argyll and Bute. Put simply, Brits have been far keener to go on holiday than start commuting again in the middle of a third wave, with implications for demand and therefore jobs in certain parts of the country.
Higher-wage areas have been least likely to see jobs bounce back to pre-crisis levels
It is plausible, however, that the sluggish recovery in city centres is being driven not just by the lack of commuters, but also by differential changes in local demand for goods and services. Studies from the US have shown, for example, that low-wage workers in more affluent areas have been most vulnerable to lay-offs, as high-income individuals responded to Covid-19 by cutting spending. Previous Resolution Foundation work has shown that, in the early days of the crisis, high-income adults did indeed cut their spending (by 57 per cent for the top income quintile of adults in working-age families). Likewise, research from the Centre for Cities has indicated that it is residents in wealthier parts of the country that have reined in their consumption. But is there evidence that this remains true as the economy has opened up?
Figure 5 suggests that this may indeed be the case. It is in areas with many affluent residents – such as Westminster, Wandsworth and Camden – where we still witness some of the largest falls in employee jobs since February 2020 (levels are between 2 and 5 per cent lower than pre-crisis).4 Even excluding London boroughs, high-wage places such as Aberdeen and Edinburgh are more likely to have experienced larger job falls (of 2.2 and 3.5 per cent respectively) than lower-wage areas. The reverse is true of low wage areas: Leicester, Cornwall and the Isles of Scilly, and Blackburn with Darwen have more employee jobs than they did in February 2020 (levels are between 1 and 2 per cent higher than pre-pandemic). Moreover, this pattern is replicated when we look to other metrics: there is a positive relationship (+0.28), for example, between pre-crisis annual pay at local authority level and the percentage point change in the claimant count between February 2020 and June 2021. Overall, a fall in demand for workers in wealthier neighbourhoods implies that affluent residents in cities are not spending to the same extent as they were pre-pandemic, be that because of pandemic-induced falls in consumer confidence or forced closures to bars and restaurants.
Figure 5: The current jobs recovery is weaker in higher-wage areas
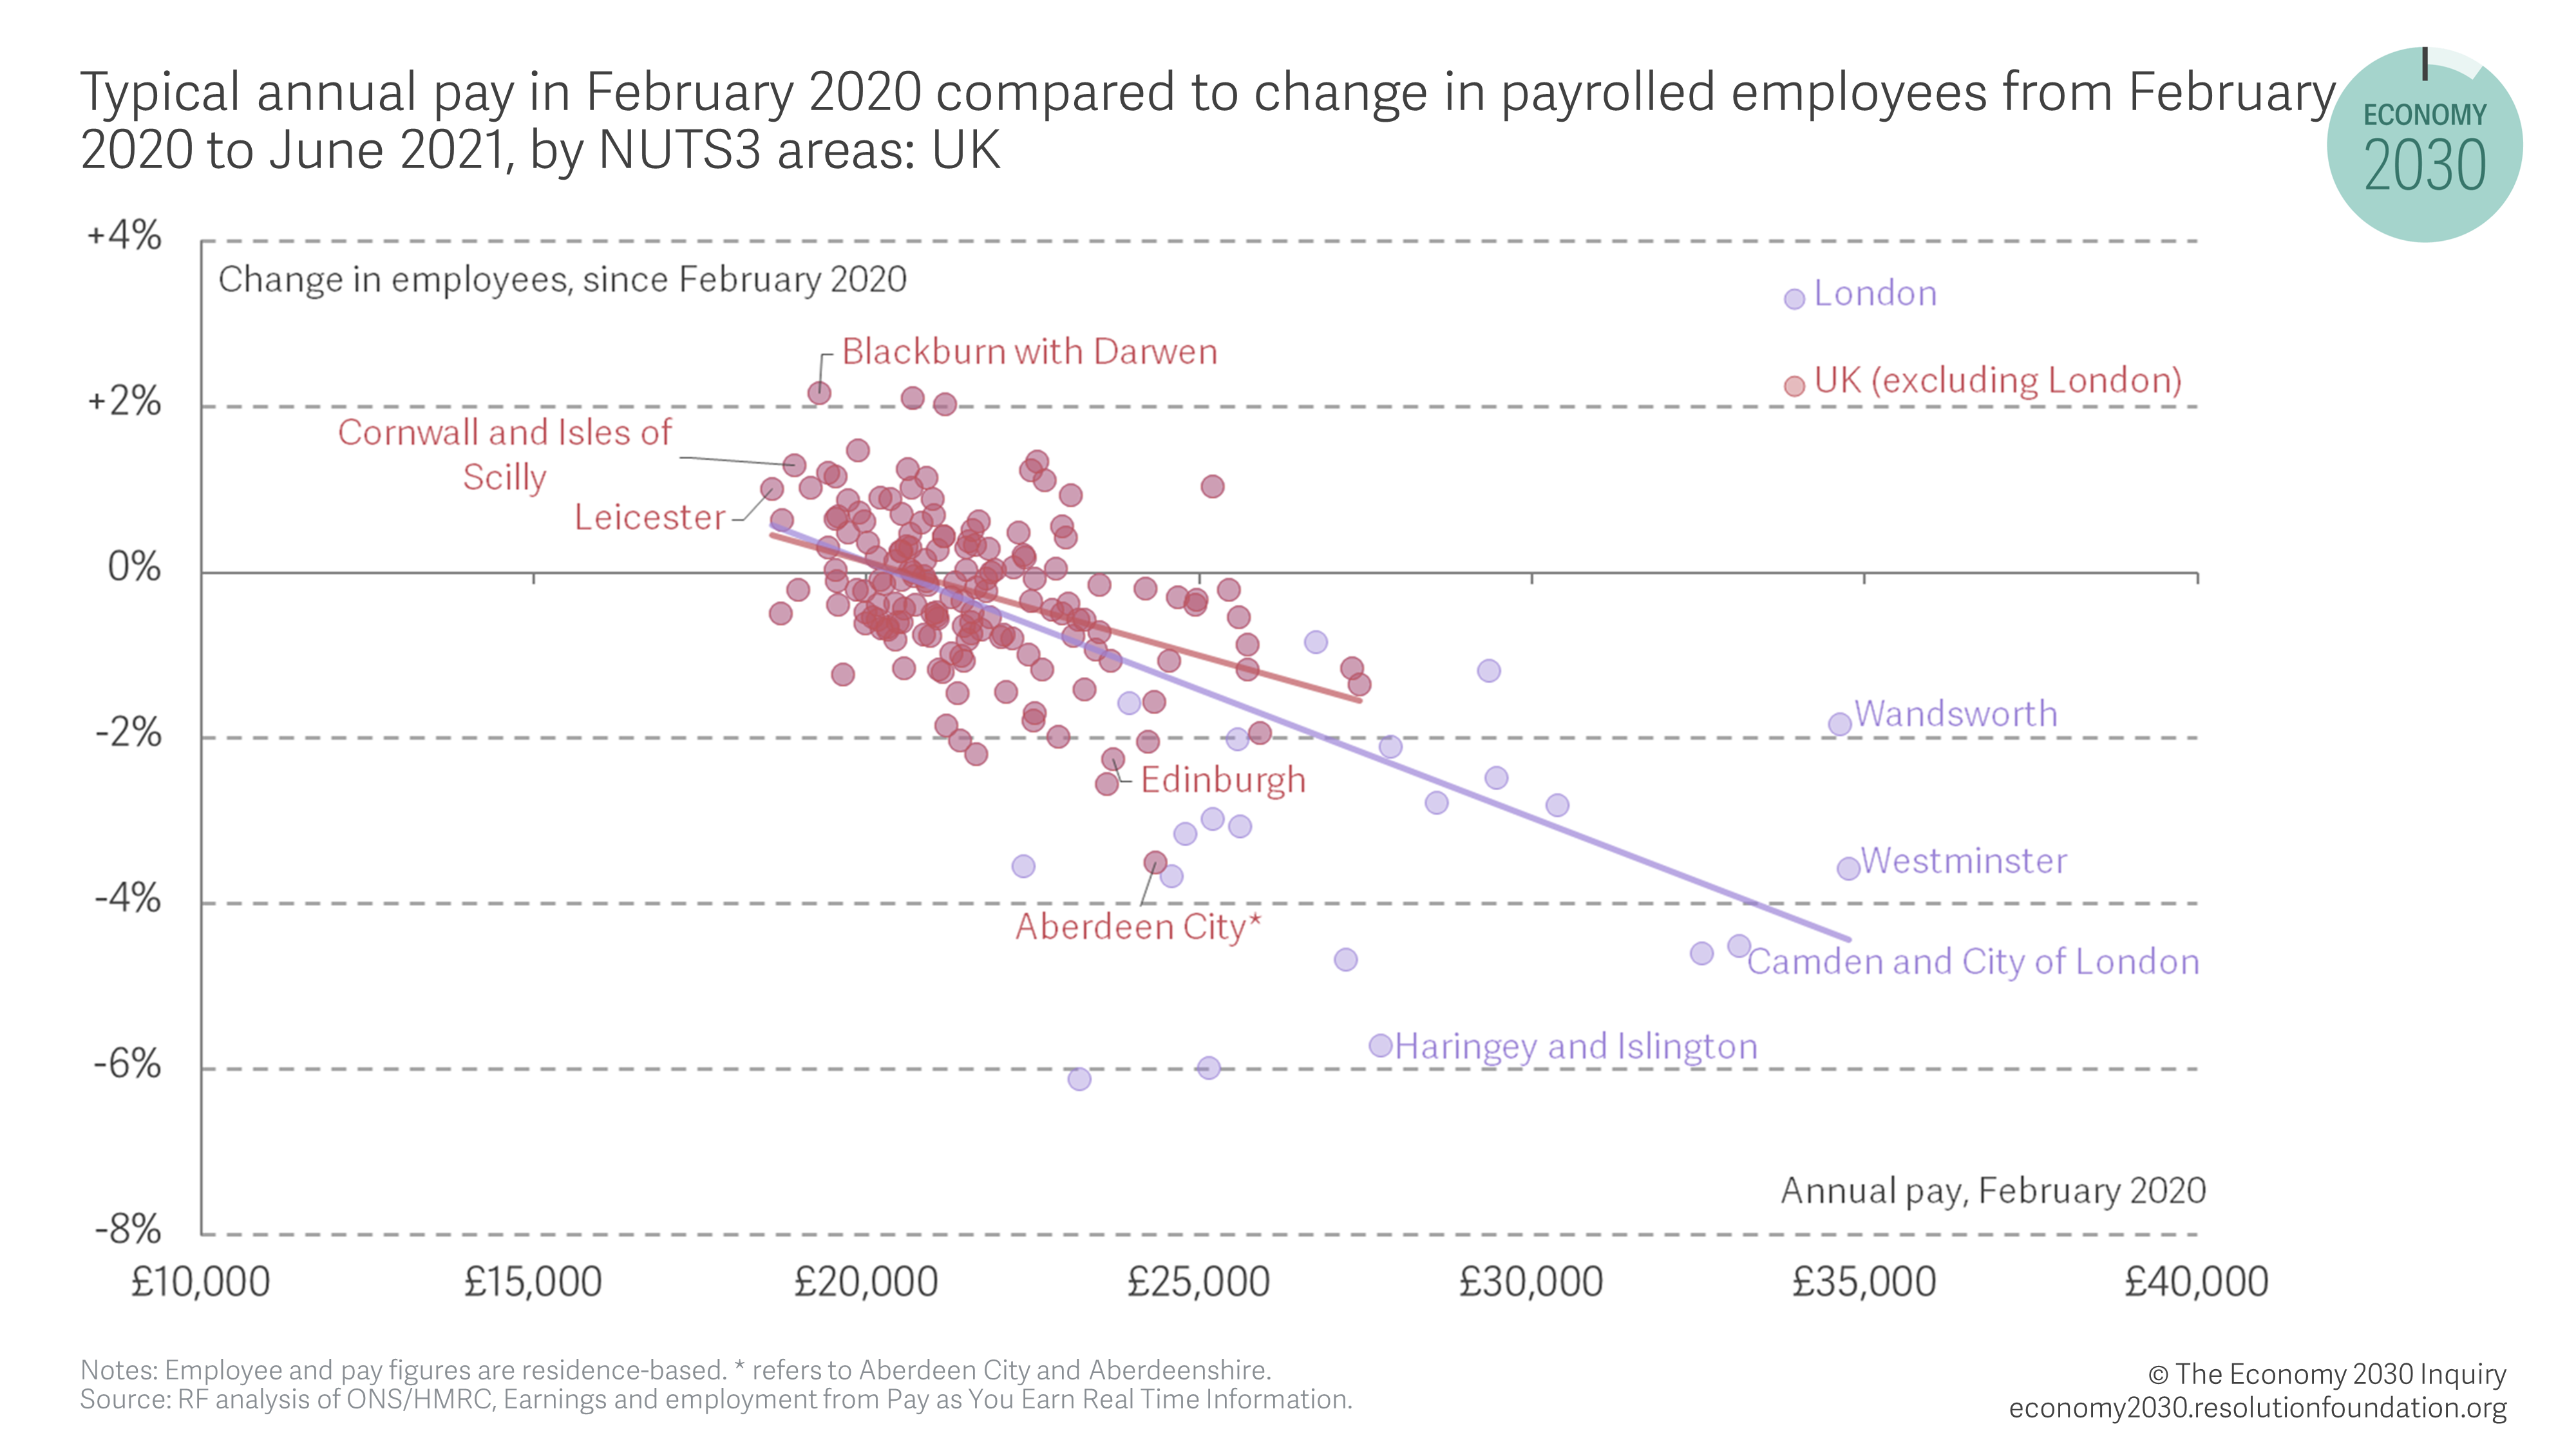
Unusually for an economic recovery, then, the most affluent areas are not (at least to date) the fastest to bounce back when it comes to employee jobs. Put this together with the fact that we know low-paid workers in every part of the country have borne the brunt of this economic crisis, and it is hard not to conclude that it is low-paid workers in high-wage areas who are at the sharp end at this point in the recovery.
Conclusion
The Covid-19 crisis has affected the labour market in every part of the country, but the initial hit and subsequent bounce back has been uneven across places. Tourism-reliant areas which were some of the worst affected at this beginning of the pandemic have seen jobs pick up in recent months, not least because of demand from those opting for ‘staycations’ this summer. In contrast, hard-hit cities have not experienced the same level of bounce back. We ascribe this to two potential effects. First, that home working continues to be standard for many, and therefore commuter footfall remains suppressed. Second, that wealthier residents in cities are also not spending to the same extent as they were pre-pandemic (or at least not locally) with additional implications for local demand.
Whether this geographical variation will endure is an open question. After all, in 2008 many expected London to be hollowed out by the financial crisis, a prediction that failed to materialise.
Today, consumer confidence remains below pre-pandemic levels but is steadily rising again. Likewise, foreign tourists will, presumably, return at some point, and then boost employment in some UK cities. But the continued reluctance of many UK workers to commute as much as they did pre-pandemic, alongside some employers’ decisions to move to hybrid working to save costs, speak to longer-term structural changes that would have enduring implications for the geographic shape of demand, and therefore jobs in many parts of the UK. We will be exploring this issue further, in partnership with the Centre for Economic Performance at the LSE, as part of The Economy 2030 Inquiry.
_____________________________________________________________________________________________
1 The Economy 2030 Inquiry is a two-and-a-half-year collaboration between Resolution Foundation and the Centre for Economic Performance at the London School of Economics studying the nature of economic change in the coming decade and developing policy responses. We are grateful for support from The Nuffield Foundation, an independent charitable trust with a mission to advance social well-being. It funds research that informs social policy, primarily in Education, Welfare, and Justice. It also funds student programmes that provide opportunities for young people to develop skills in quantitative and qualitative methods. The Nuffield Foundation is the founder and co-funder of the Nuffield Council on Bioethics and the Ada Lovelace Institute. The Foundation has funded this project, but the views expressed are those of the authors and not necessarily the Foundation. Visit www.nuffieldfoundation.org.
2 When we look at changes to self-employment, a similar picture emerges. Self-employment lags its pre-crisis levels in all regions, often by a considerable margin, but data from Q1 2020 to Q1 2021 shows that it is those regions that saw the number of self-employed workers fall the most (like London and the South East) still have the longest way to go to reach pre-pandemic levels. Source: RF analysis of ONS, Labour Force Survey.
3 The PAYE employee jobs data is only available at a NUTS1, NUTS2 and NUTS3 level. But HMRC furlough data provides data below the NUTS3 level at local authority level. This administrative geography is the preferred unit of analysis given that most other local geographic data tends to be reported at this level and because local authorities have responsibility for the delivery of local government services.
4 This relationship holds when we compare other measure of economic prosperity: employee job falls have been larger in areas with higher Gross Disposable Household Income.
Contact
For all research queries about this report, please contact Charlie McCurdy. For press queries, please contact the Resolution Foundation press office.

Charlie McCurdy
Economist
Resolution Foundation
Email Charlie