Minding the (productivity and income) gaps

This week’s round of international economic forecasts (from the IMF, Federal Reserve, European Central Bank, and Bank of England) has seen a renewed focus on the UK’s relative economic decline. But while gloomy forecasts about the coming years dominate headlines this expected weak economic growth comes on the back of 15 years of the UK economy lagging behind those of our international peers. This decline has been driven by disappointing productivity growth in the UK with labour productivity growing by just 0.4 per cent a year in the 12 years following the financial crisis (half the rate of that of the 25 richest OECD economies).
The UK’s decade of weak productivity growth is clearly important for understanding it’s relative economic decline, but how important is it in the story of household income gaps? For some, productivity growth is all that matters for typical household incomes. But others have argued that this is no longer the case and that incomes and productivity have ‘decoupled’. The truth, as always, is more complicated and somewhere in between. The US, France and Germany are all around one-sixth more productive than the UK. But these uniform gaps in productivity translate to widely different gaps in median household incomes: from 11 per cent relative to France to a colossal 63 per cent relative to the US. Precise comparisons between countries are hampered by differences in measuring and defining prices and incomes. They nonetheless illustrate how individual choices, policy regimes and economic structure can all affect the relationship between household incomes and GDP.
In France, higher productivity is ‘spent’ on working less rather than earning more, while lower inequality helps boosts incomes for typical households. Germany is also more equal and does better than the UK in saving and investing for the long term. Households in Germany receive a smaller share of national income, but in the long run this is more than offset as higher investment and savings boost GDP and raise foreign assets and income earned from these assets. In the USA, workers work longer hours , pay lower taxes, and so end up with a lot more money (half as much again as typical UK households). But they have to spend more of this on healthcare than in Europe.
Overall, while boosting productivity remains the most reliable means to improving living standards in the UK (where UK performance has been weak for many years), our analysis shows that the extent to which this extra potential income gets translated into extra money for household budgets, is an outcome of a complex mix of government policy and personal and cultural preferences.
This week’s round of international economic forecasts has brought with it a renewed focus on the UK’s relative economic decline. However, the context to these projections of weak economic performance over the next few years, is fifteen years of relative economic decline.
The US, France and Germany are all around one-sixth more productive than the UK, measured in terms of GDP per hour worked. And as we set out in the Interim Report of the Economy 2030 Inquiry, this gap has grown over time following a decade of disappointing productivity growth in the UK.
But these relatively uniform productivity gaps translate into widely varying gaps in mean household incomes – from a negligible 1 per cent with France to a colossal 67 per cent with the United States. Indeed, looking across the OECD, as we do in Figure 1 below, demonstrates the variation in productivity in incomes gaps more generally. The 45 degree line represents the relationship which would hold if a difference in productivity between two countries was matched by a proportional difference in median incomes between them. Although the dots representing each country in the OECD fall roughly along this line (pointing to the importance of productivity in determining living standards), there are important exceptions. For example, although South Korea is 40 per cent less productive than the UK, its median incomes are measured as 15 per cent larger. Therefore, it is clear that while productivity is a crucial determinant of household incomes it is not everything.
Figure 1: Differences in productivity do not translate into proportional differences in incomes

In this spotlight we go beyond the debate about whether productivity growth drives growth in incomes and explore what causes the differences in these gaps, decomposing these differences into a number of factors, some of which are easy to measure and understand, and others which are less clear. What this analysis shows us is that these gaps are the result of a combination of individual preferences, policy regimes and economic structure, some of which can be influenced by governments and some of which cannot.
Our conclusions are relatively simple:
- Higher employment relative to France, and workers working longer hours relative to their counterparts in Germany, support the income of UK households relative to those more productive European comparators. But it is an open question whether large further increases in UK labour input are possible or desirable here, and in particular whether extra money for extra work would improve welfare.
- Measured household incomes in France and especially Germany, relative to the UK, are boosted by some less intuitive and more obscure factors relating to the relative prices of consumption and output, as well as survey coverage.
- The UK’s high level of inequality, by European standards, means that the gaps between median household incomes in the UK and those in Germany and France are around 10 to 12 percentage points larger than those between mean household incomes.
- Boosting productivity – where the UK is most consistently doing badly – while containing inequality, appears to be the surest and most unambiguous route to raising average living standards in the UK.
From productivity to income in theory
The starting point of our analysis is an identity that breaks down the mapping from GDP per hour (our measure of productivity) to mean equivalised income per household into a series of steps which we can then interpret. An explanation of these steps is included in an Appendix below.[1]
GNDI stands for gross national domestic income – the income available to a country accounting for how a country may owe a portion of its output to foreigners in the form of interest, profits and dividends on domestic assets, and it may receive a fraction from overseas too. GDHI stands for gross domestic household income which reflects the amount of national income that the household sector receives after taxes and transfers are paid. The residual represents the difference between survey measures of household income and GDHI which reflects issues with survey coverage leading to over or under reporting of income.
In France, higher worker productivity combines with fewer workers
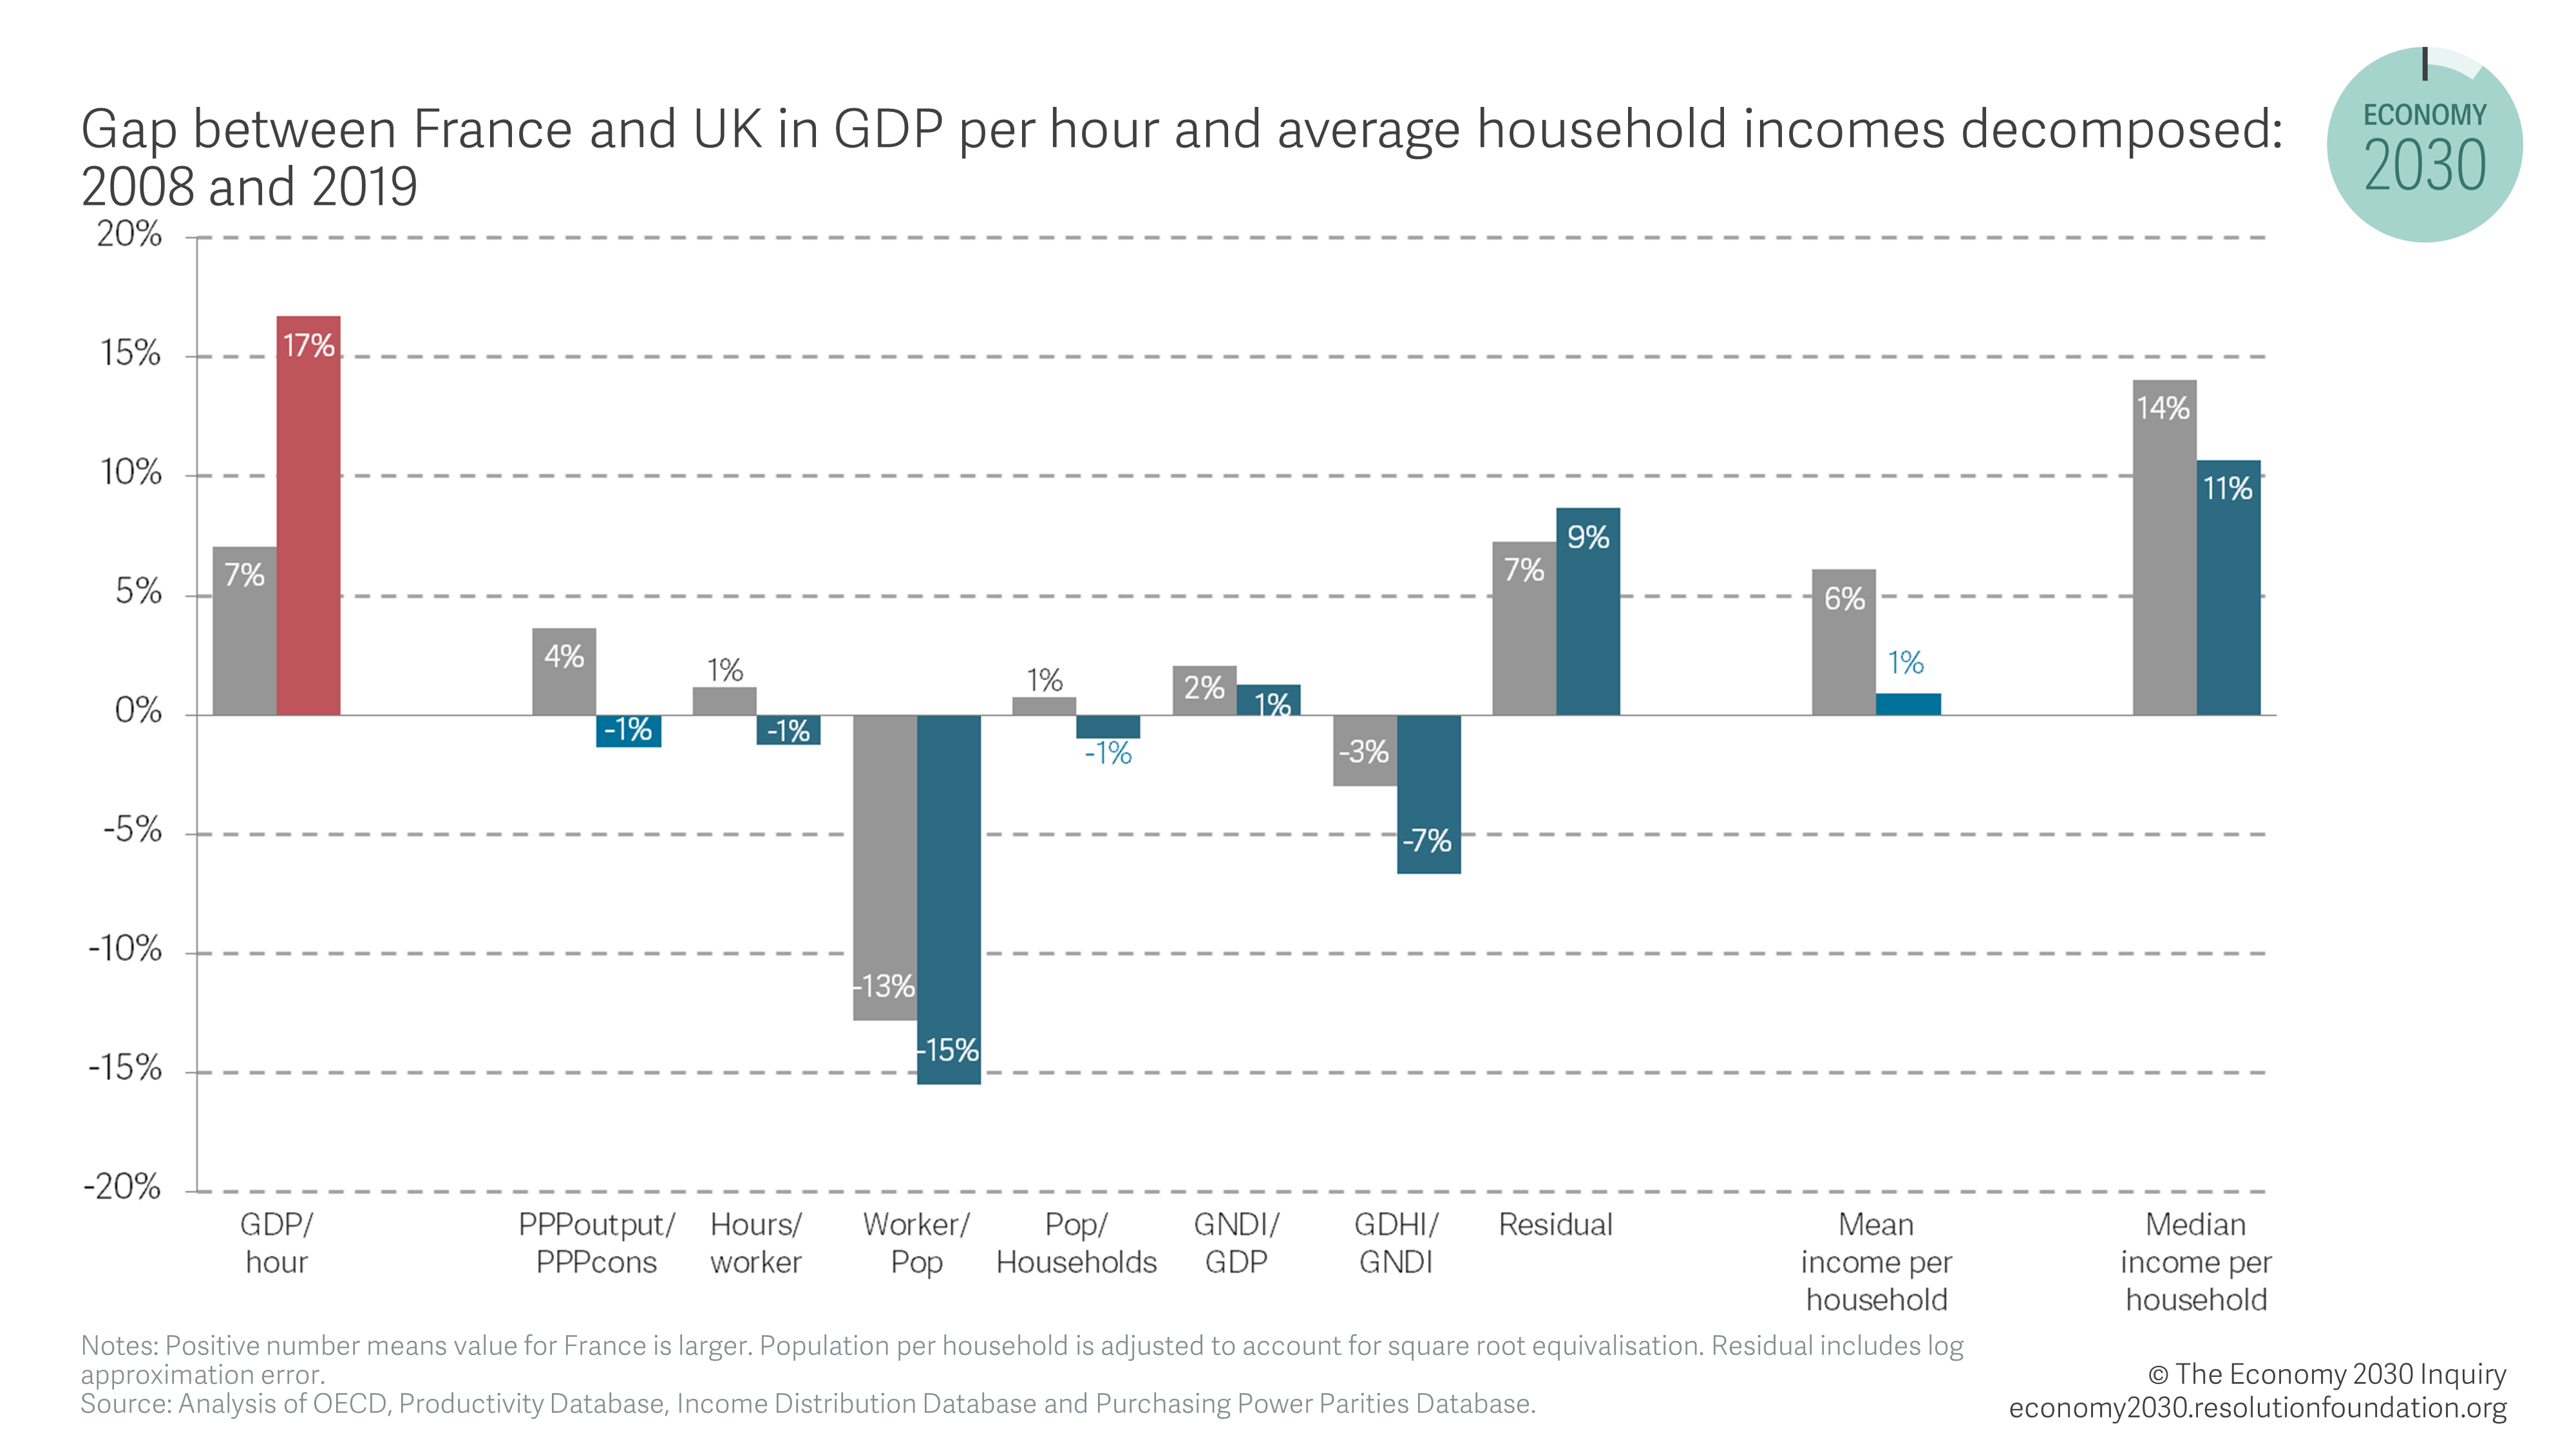
We start with the case of France, which is relatively easy to understand and is set out in Figure 2 below. French workers are about 17 per cent more productive than the UK’s, but this translates into a smaller gap in mean household incomes of 1 per cent. The reason for this is that there are about 15 per cent fewer workers per capita in France relative to the UK (due to a more generous retirement age and significantly lower employment levels among those aged under 24). In some senses this higher productivity is “spent” on working less, with more years able to be spent in retirement and education relative to the UK. This phenomenon explains the bulk of the difference in the gap between incomes and productivity between the UK and France.
Other smaller differences are also relevant to the precise size of income gaps. French households receive a 7 per cent smaller share of national income than their UK counterparts, as their companies retain (and invest) more profits, and their government levies higher net taxes. Importantly, French survey incomes are boosted a huge 9 per cent by the residual, relative to GDHI. This residual may reflect poorer coverage of items such as imputed rents and self-employment income, which may be larger components of income in the UK than in France. The chart shows that mean income per equivalised household, measured from the national accounts is around 8 per cent lower in France than in the UK, rather than 1 per cent higher as it is when considering survey measures of mean income. However, assuming that surveys accurately reflect the gap between mean and median incomes, the more equal income distribution in France pushes median income above the UK’s even if we ignore differences between surveys and national accounts.
Figure 2: Fewer workers means the productivity gap with France translates into a modest gap in mean incomes

As well as decomposing the current gaps in productivity and incomes between the UK and France, we can also look at how the impact of these contributing factors has changed over time. This is illustrated in Figure 3, with the grey bars reflecting the value of the gaps and the relative importance of the factors in the decomposition in 2008 while the coloured bars show values in 2019 as above. In 2008 French workers were 7 per cent more productive than their UK counterparts (less than half the 17 per cent advantage they enjoy in 2019), but this translated into French mean household incomes being 6 per cent larger than their UK counterparts. This higher level of incomes relative to the UK was sustained by a smaller difference in the number of workers per capita in the two economies, as well as French households keeping a similar proportion of national disposable income as UK households. Differences in the relative prices of output and consumption between the UK and France were also more significant in supporting French incomes (the goods and services they produced were more expensive than those they consumed compared to the UK).
Figure 3: The productivity gap between the UK and France has grown since 2008 but the income gap has declined
Investment means the gap in household incomes is smaller than the gap in productivity between UK and Germany
The gap in German household incomes is about the same as the gap in productivity – 12 and 14 per cent respectively (Figure 4). The two labour supply components – hours and employment – are broadly offsetting. Relative prices boost incomes 6 per cent relative to output, but the smaller size of German households makes them 8 per cent poorer.[ii] And in common with France, measured income in the surveys relative to the national accounts again boosts income by 9 per cent relative to the UK.
Importantly, German national income gets a boost of 4 per cent relative to GDP, presumably given its status as a large creditor country, but households get a smaller slice of this income, with more kept by corporations and net taxes. These retained earnings can be used to finance higher levels of investment which pay off over the long-term. Germany’s economic model involves lower levels of household income and consumption that may otherwise be used to fund high levels of investment.
Figure 4: The gap in average incomes between UK and Germany is similar to the gap in productivity

Longer hours boost an already large productivity gap with the US
Next, we turn to the United States, where the picture looks very different (Figure 5). US real incomes are boosted, relative to productivity, a huge 12 per cent by relative prices. This means that consumption is 12 per cent cheaper than you would expect in the US compared to the UK, given the relative prices of output in the two countries.[iii] Incomes are boosted a similar amount by higher hours per worker and by a larger household share of national income, perhaps because of lower net taxes. Relative to national accounts, surveys appear to under-record incomes by 16 per cent, perhaps because more incomes are received, and under-recorded, at the very top in the US. This would also help to explain the puzzling finding that the mean and median survey incomes gaps are about the same compared to the UK, despite what we know about higher inequality in the US.
Figure 5: Working more hours and lower taxes adds to the US productivity advantage
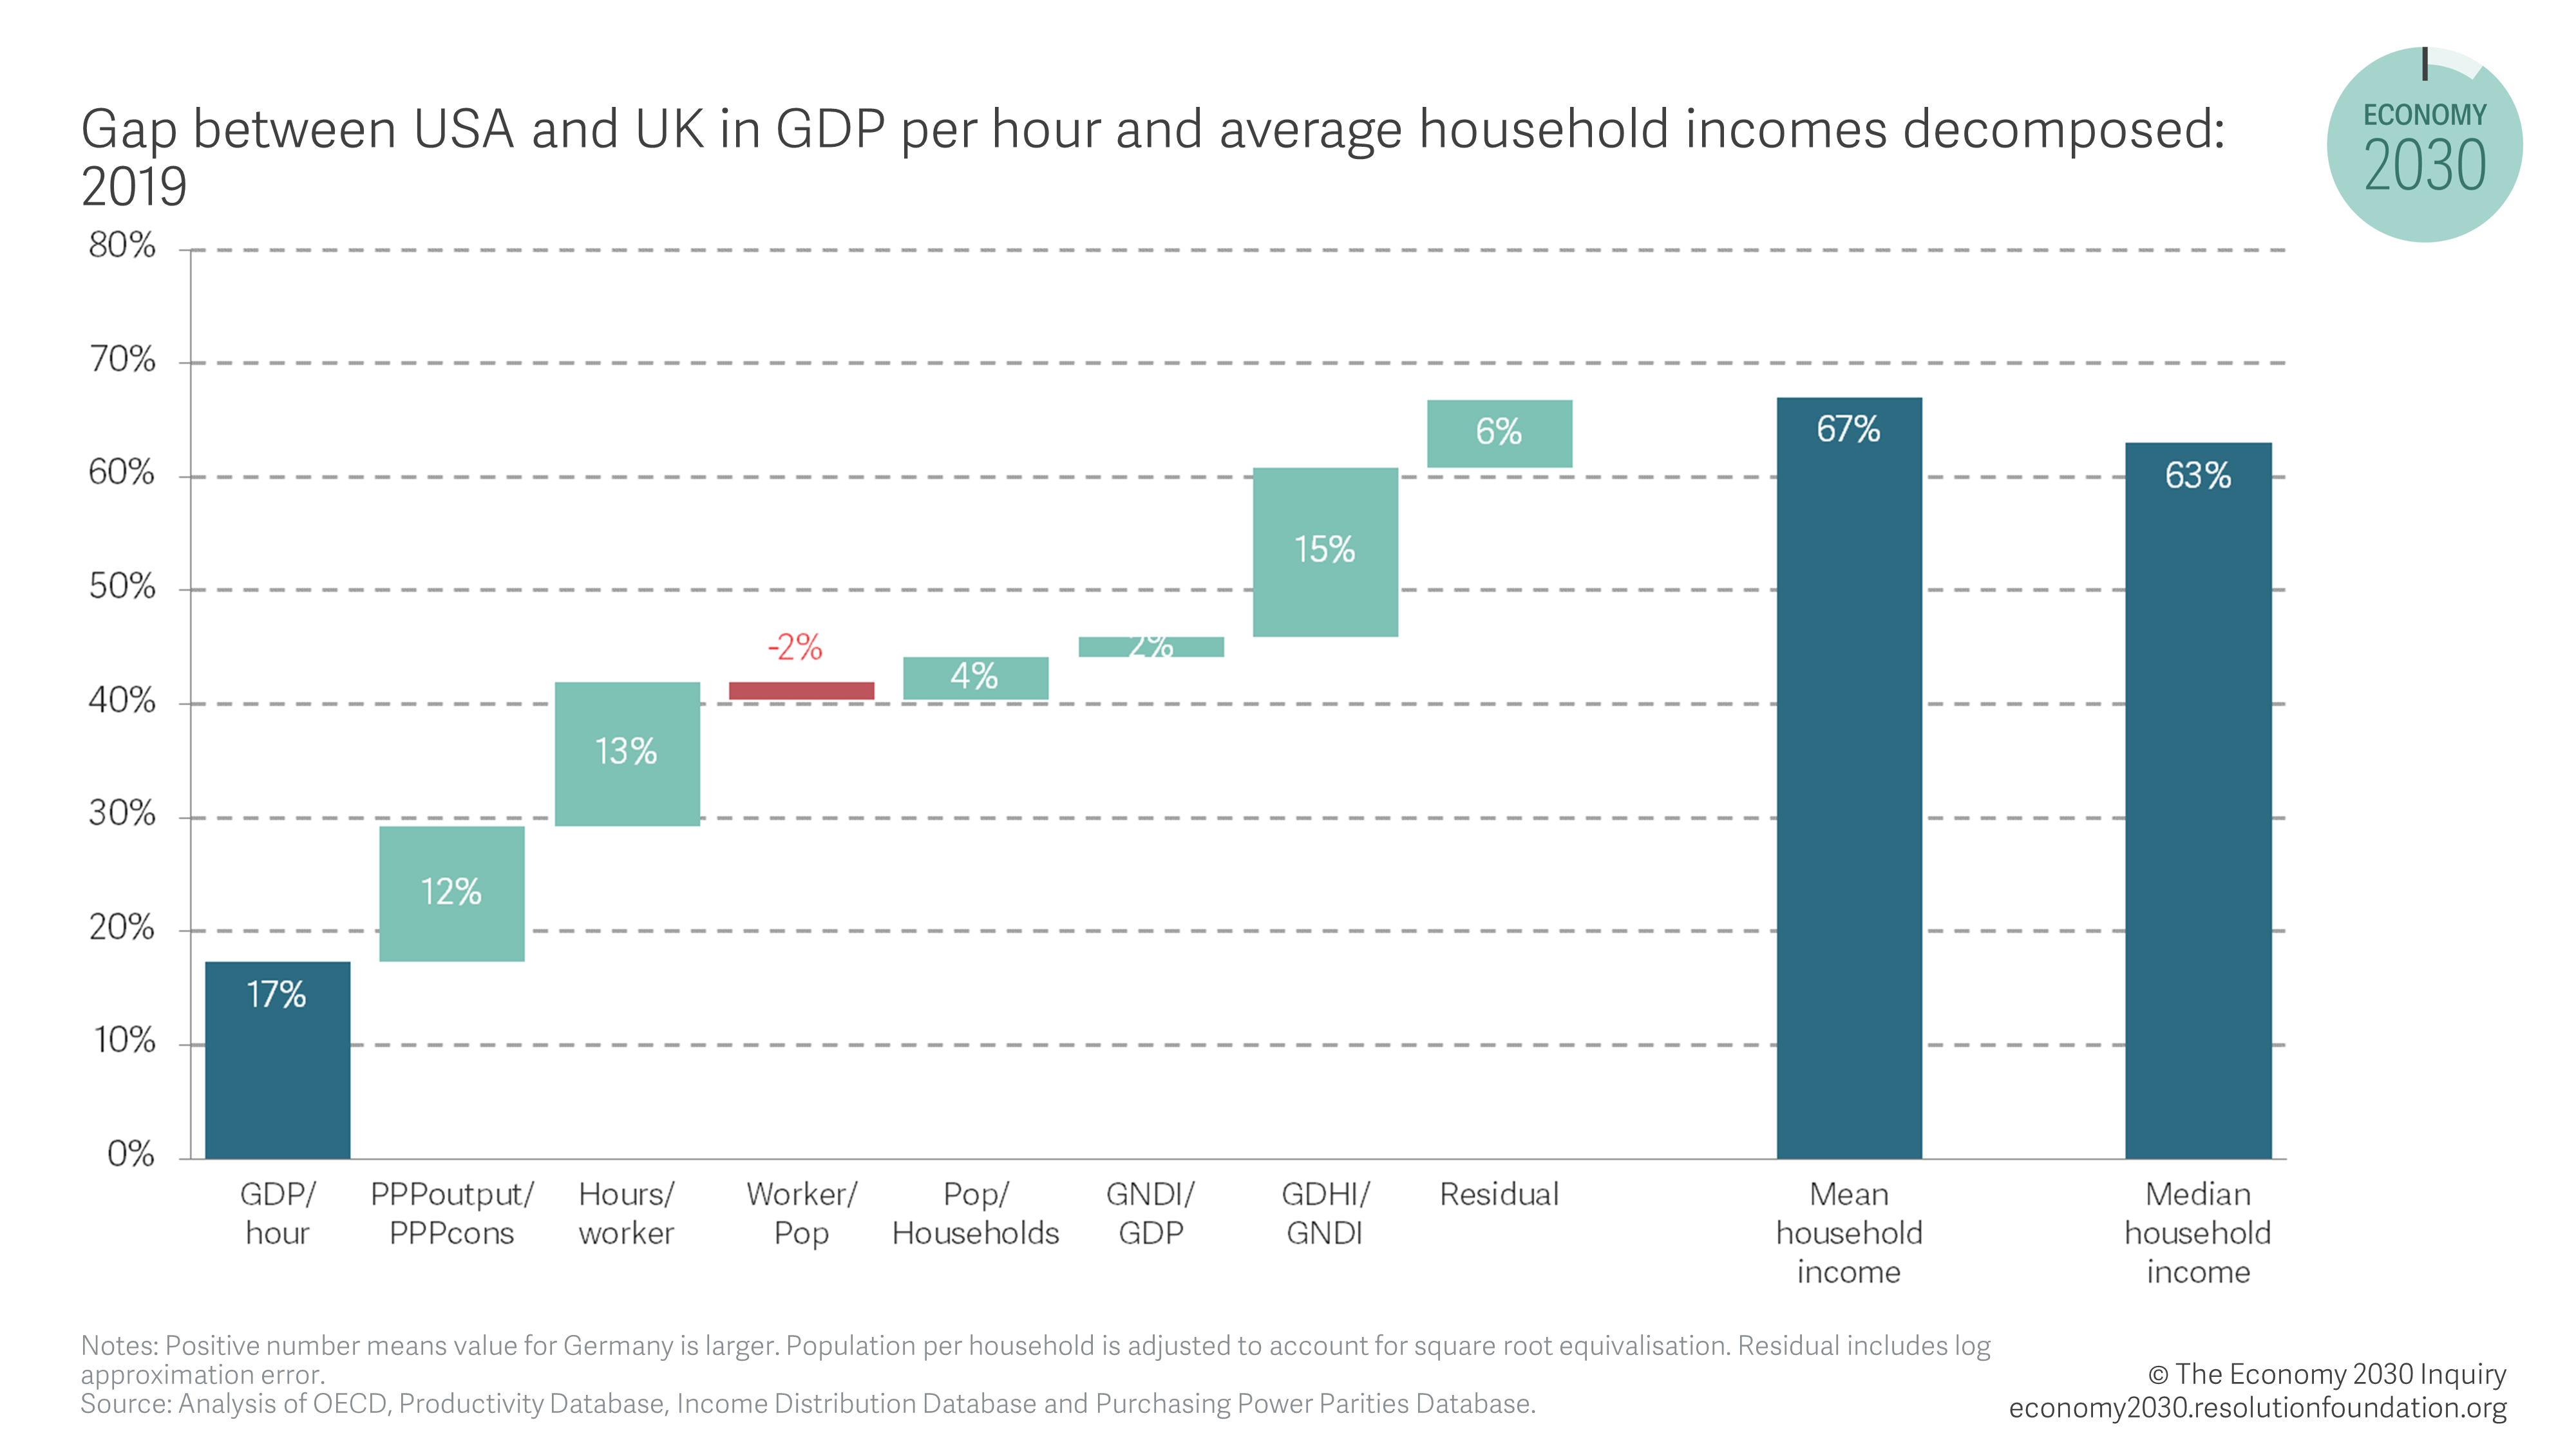
Since 2008 the gap in productivity between the UK and the US has grown by 3 percentage points (from 14 per cent to 17 per cent) while the gap in mean incomes per household has increased by 15 percentage points with the US moving 36 per cent richer to 63 per cent richer. This divergence in productivity and income gaps has been driven entirely by changes in the contribution of the residual.
Lessons for future work
Overall, our results show that, at least in regard to the three highly productive large countries we have considered, productivity gaps of a roughly similar size can translate into income gaps of widely varying sizes. Higher employment per capita in the UK relative to France means that the gap in mean household incomes between the two nations are smaller than the gap in productivity. In Germany the impact of workers in the UK working longer hours is offset by having fewer workers per capita which means that gaps in income and productivity between the two countries are similar in size.
These differences in hours, employment and household size are important in explaining how gaps in productivity translate into gaps in income, but the extent to which policy can impact them varies. In the case of employment and hours worked it may be that some members of the population would prefer to supply more labour, or that changes to state retirement ages could have big impacts. Equally given evidence of increasing work intensity and stress others may also prefer to work fewer hours or retire earlier.
Other factors such as household size for example may reflect individual preferences and cultural norms – we could move back in with our parents and be richer in equivalised terms, but not necessarily happier.
Economic structure is also a key determinant of how household incomes reflect productivity levels, a country such as Germany which saves to invest will see less of its production being received as household income, but over the long term as investment pays returns this deferred consumption is returned as higher income in the future.
Our analysis also shows that the UK’s high level of inequality is important in explaining the gaps between typical household incomes, especially those with Germany and France. The fact that gaps in median household incomes are so much larger than those in mean household incomes (roughly 10 to 14 percentage points) demonstrates this.
The most reliable means to improve living standards in the UK remains to boost productivity (where UK performance has been weak for many years). Whether this extra potential income gets translated into extra actual income, and indeed whether it should be, is a matter of government policy as well as personal choice.
[1] B Nolan, M Roser & S Thewissen, GDP per capita versus median household income, The Review of Income and Wealth, September 2019, used a similar framework to analyse differences in the relative growth rates of national output and household income.
[ii] There are economies of scale in household size – bigger households are cheaper to run per person. So, a country (like Germany) with smaller households will have higher costs, and hence lower equivalised Incomes, other things equal.
[iii] This number is surprisingly large given that household consumption is around ⅔ of GDP. If there are no differences due to taxes, this seems to imply that the non-consumption components of GDP must be around 28 per cent relatively more expensive, or that the terms of trade are making a similar large contribution to consumption relative to GDP. This casts some doubt on the consistency of these statistics.